Project
GitKraken Insights
Engineering managers have data in Jira, Git, CI, Slack and multiple AI tools, but no reliable way to understand “what changed” and “why” without manual digging. Existing dashboards showed numbers, not narratives — causing delayed interventions and low trust in metrics. So we created a product to detect bottlenecks and improve developers’ hygiene in all levels - CTO/VP of enginering, engineering team leads and developers.
Timeframe
0 to 1 project - the whole initiative started because there was an idea to cover team leads/developer leads problems
My role
I created and leaded all Insights interface work working closely with analysts, developers, PMs and stakeholders.
Process
PM, Development lead and me as designer worked closely together and setting up goals and prioriries
Outputs
We launched MVP in less than 6 months and got a lot of positive feedback and first customers
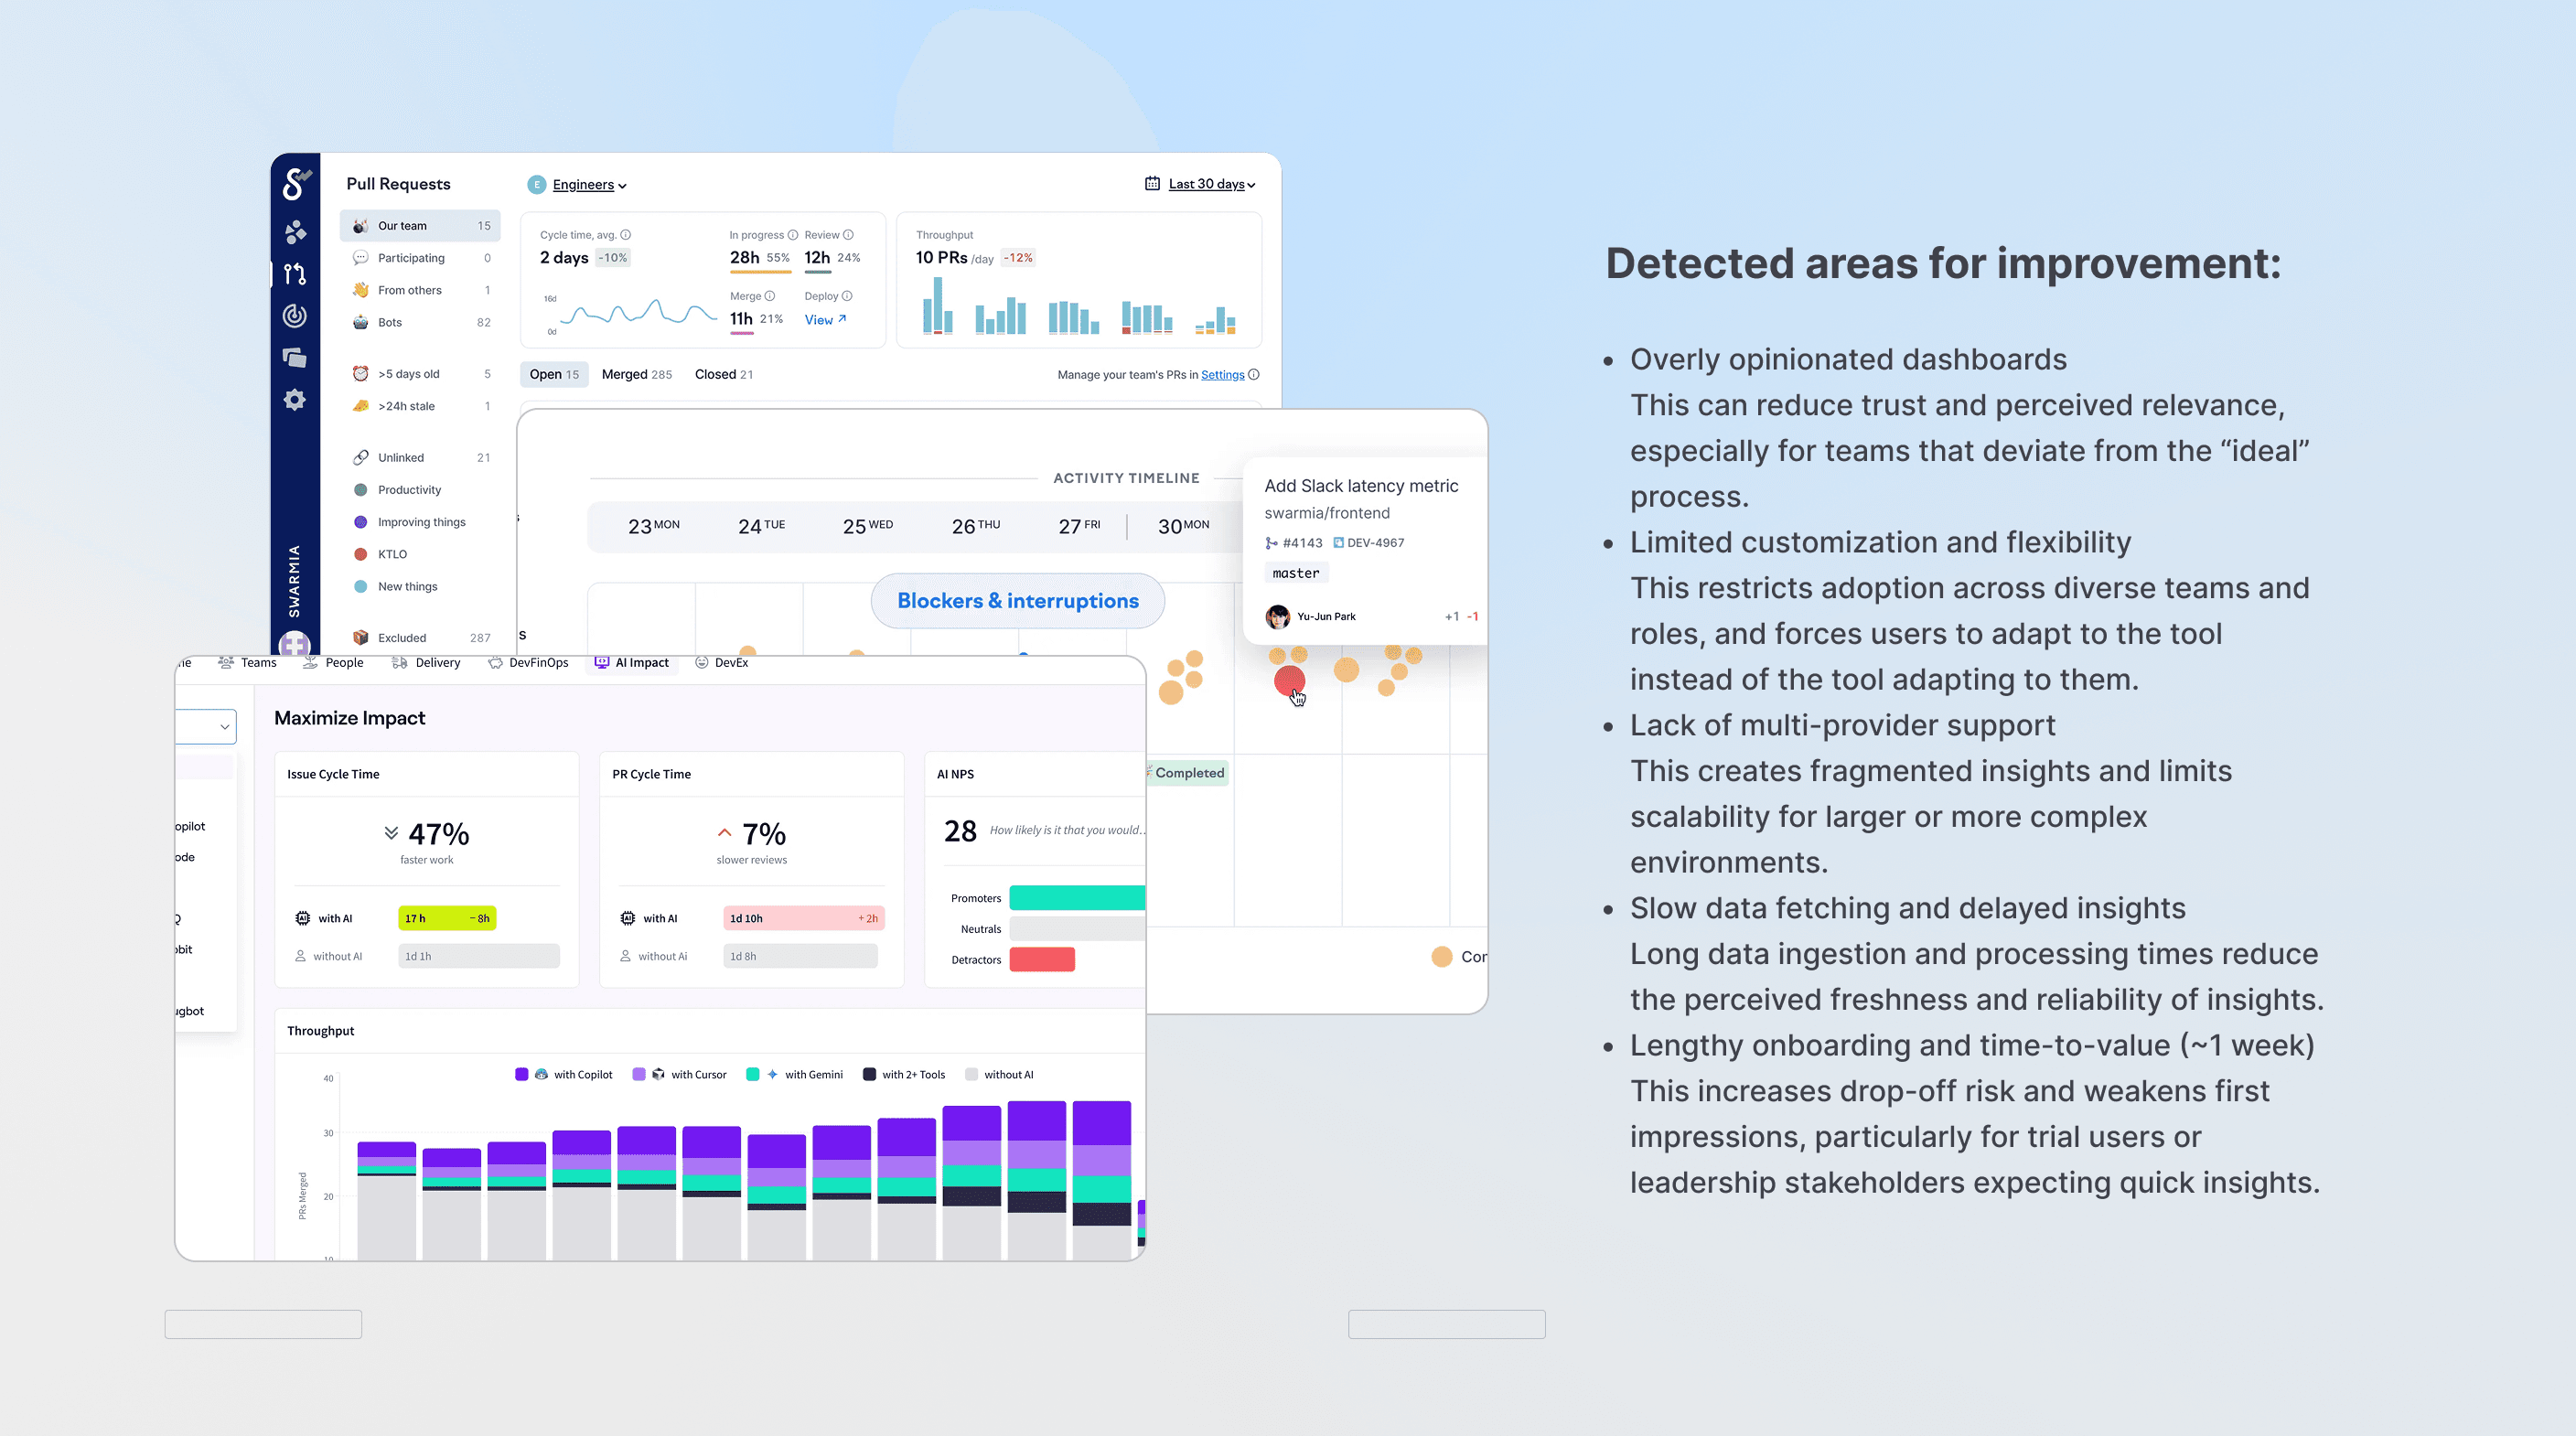
The project was grounded in extensive qualitative research, including multiple interviews with engineering managers, tech leads, and product stakeholders. The research team revealed that while teams use a wide range of analytics and delivery tools, these solutions lack flexibility: they offer rigid, predefined dashboards, make it difficult to create views tailored to different teams or goals, and provide limited visibility into emerging workflows such as AI-assisted development. As a result, teams struggle to adapt metrics to their context and cannot reliably track how AI tools are actually used and where they create value.
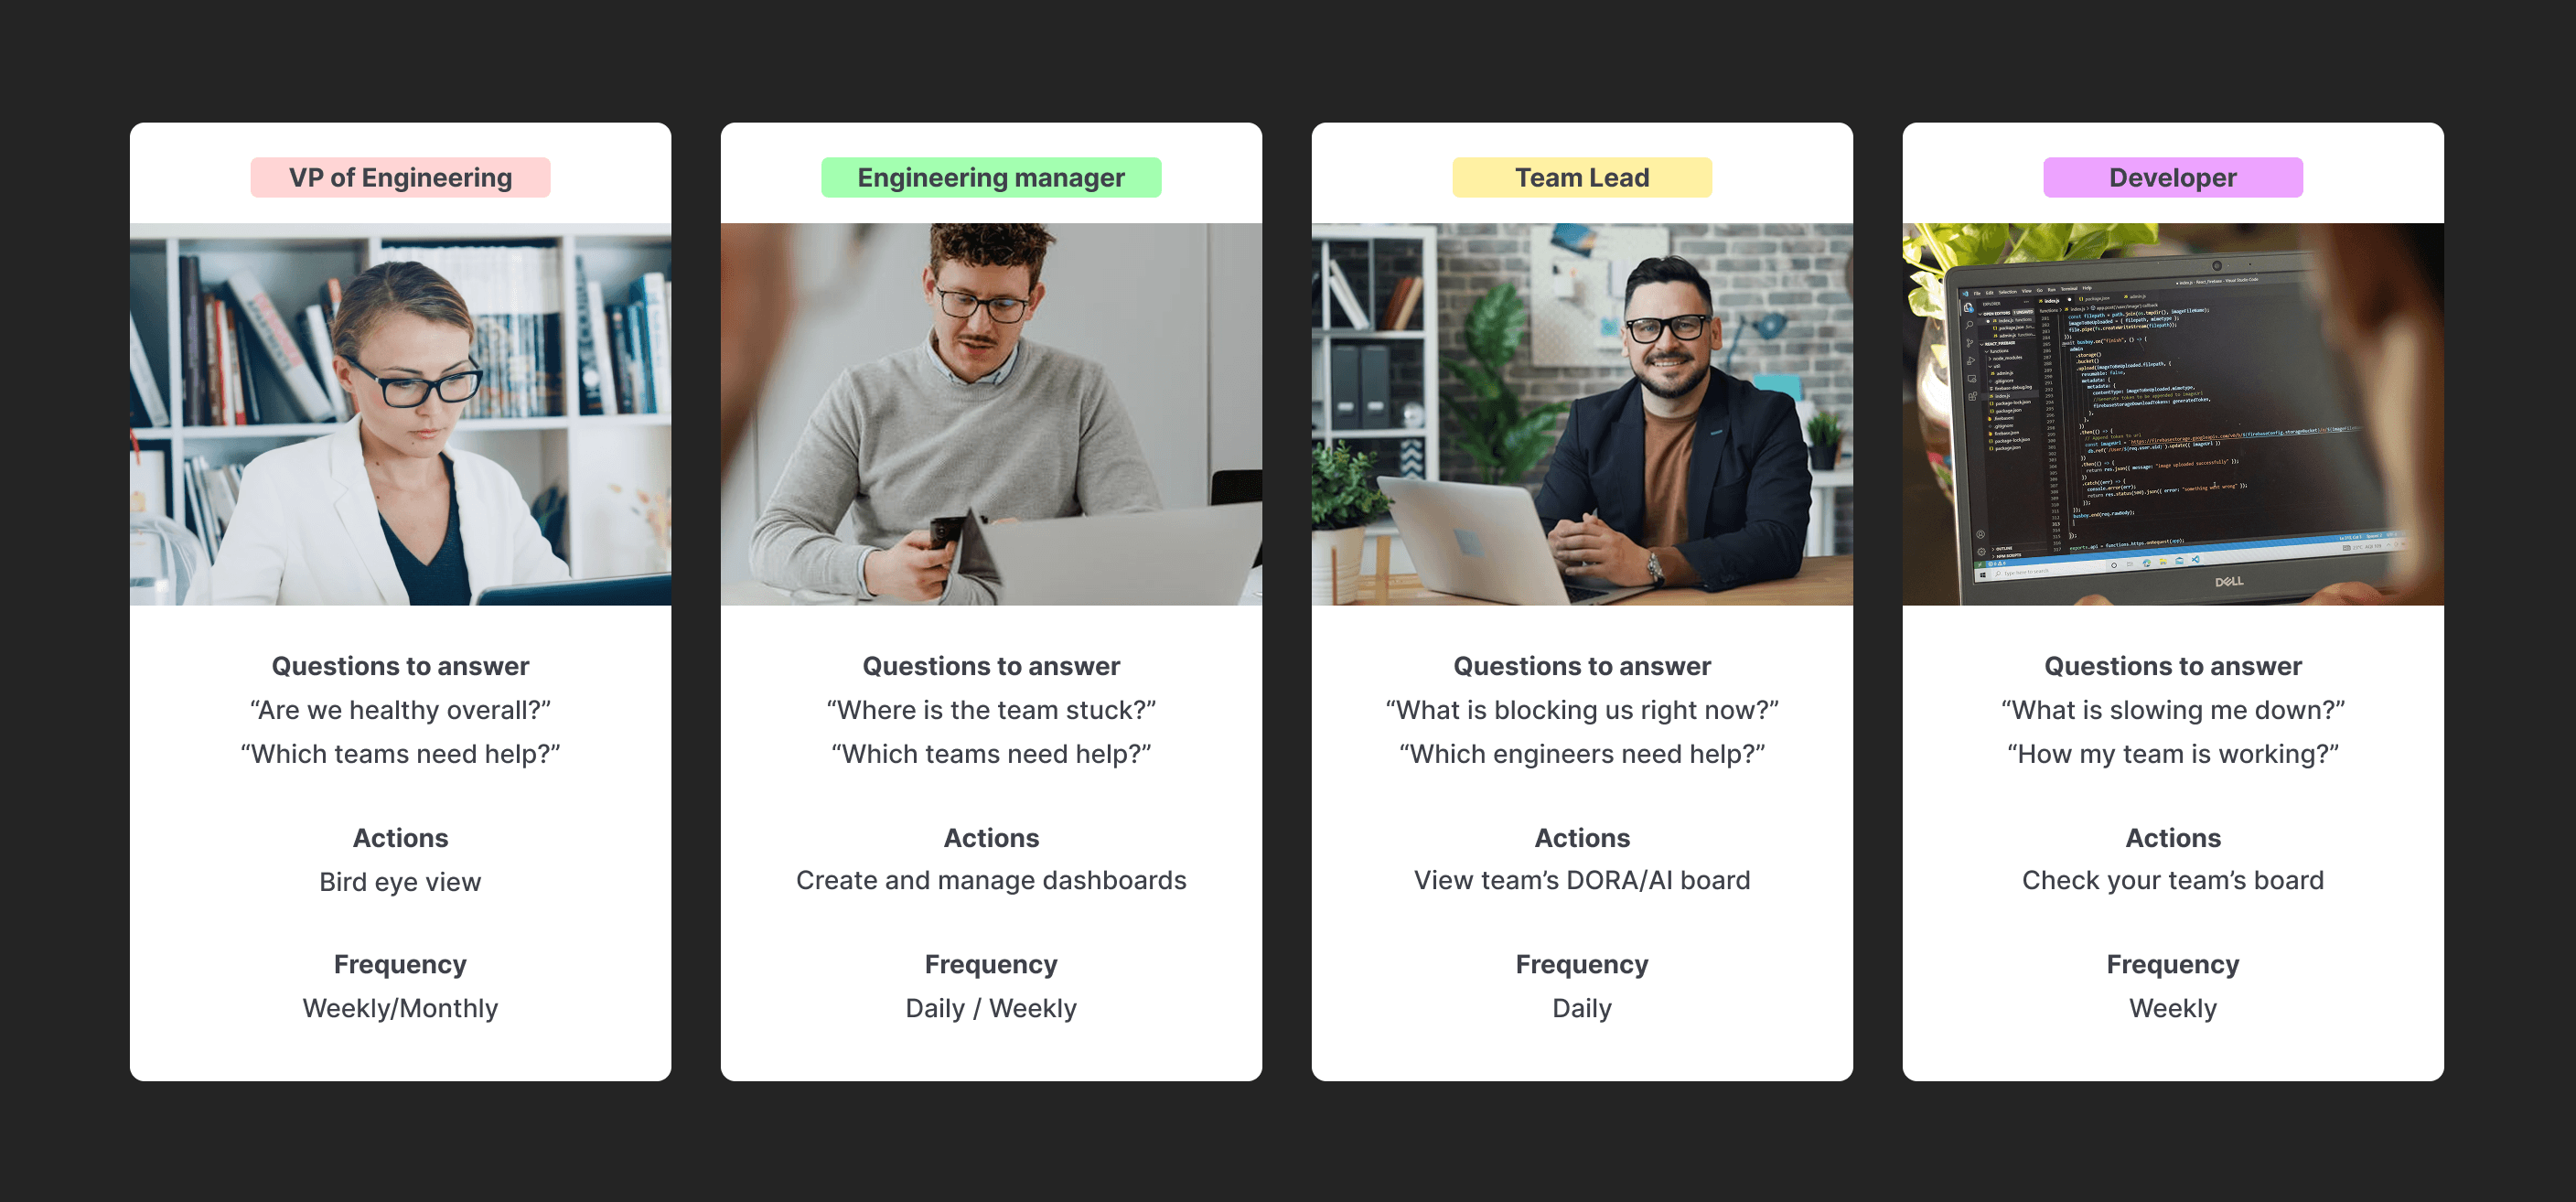
The primary users are Engineering Managers and Tech Leads responsible for delivery health and team performance. They need to quickly detect early risk signals, understand what drives metric changes, and make informed trade-offs under time pressure. Secondary users include Product and Delivery Managers who rely on the same data to track progress and communicate status across stakeholders. All personas share a common need for trustworthy, explainable metrics that reduce manual investigation and support confident decision-making.
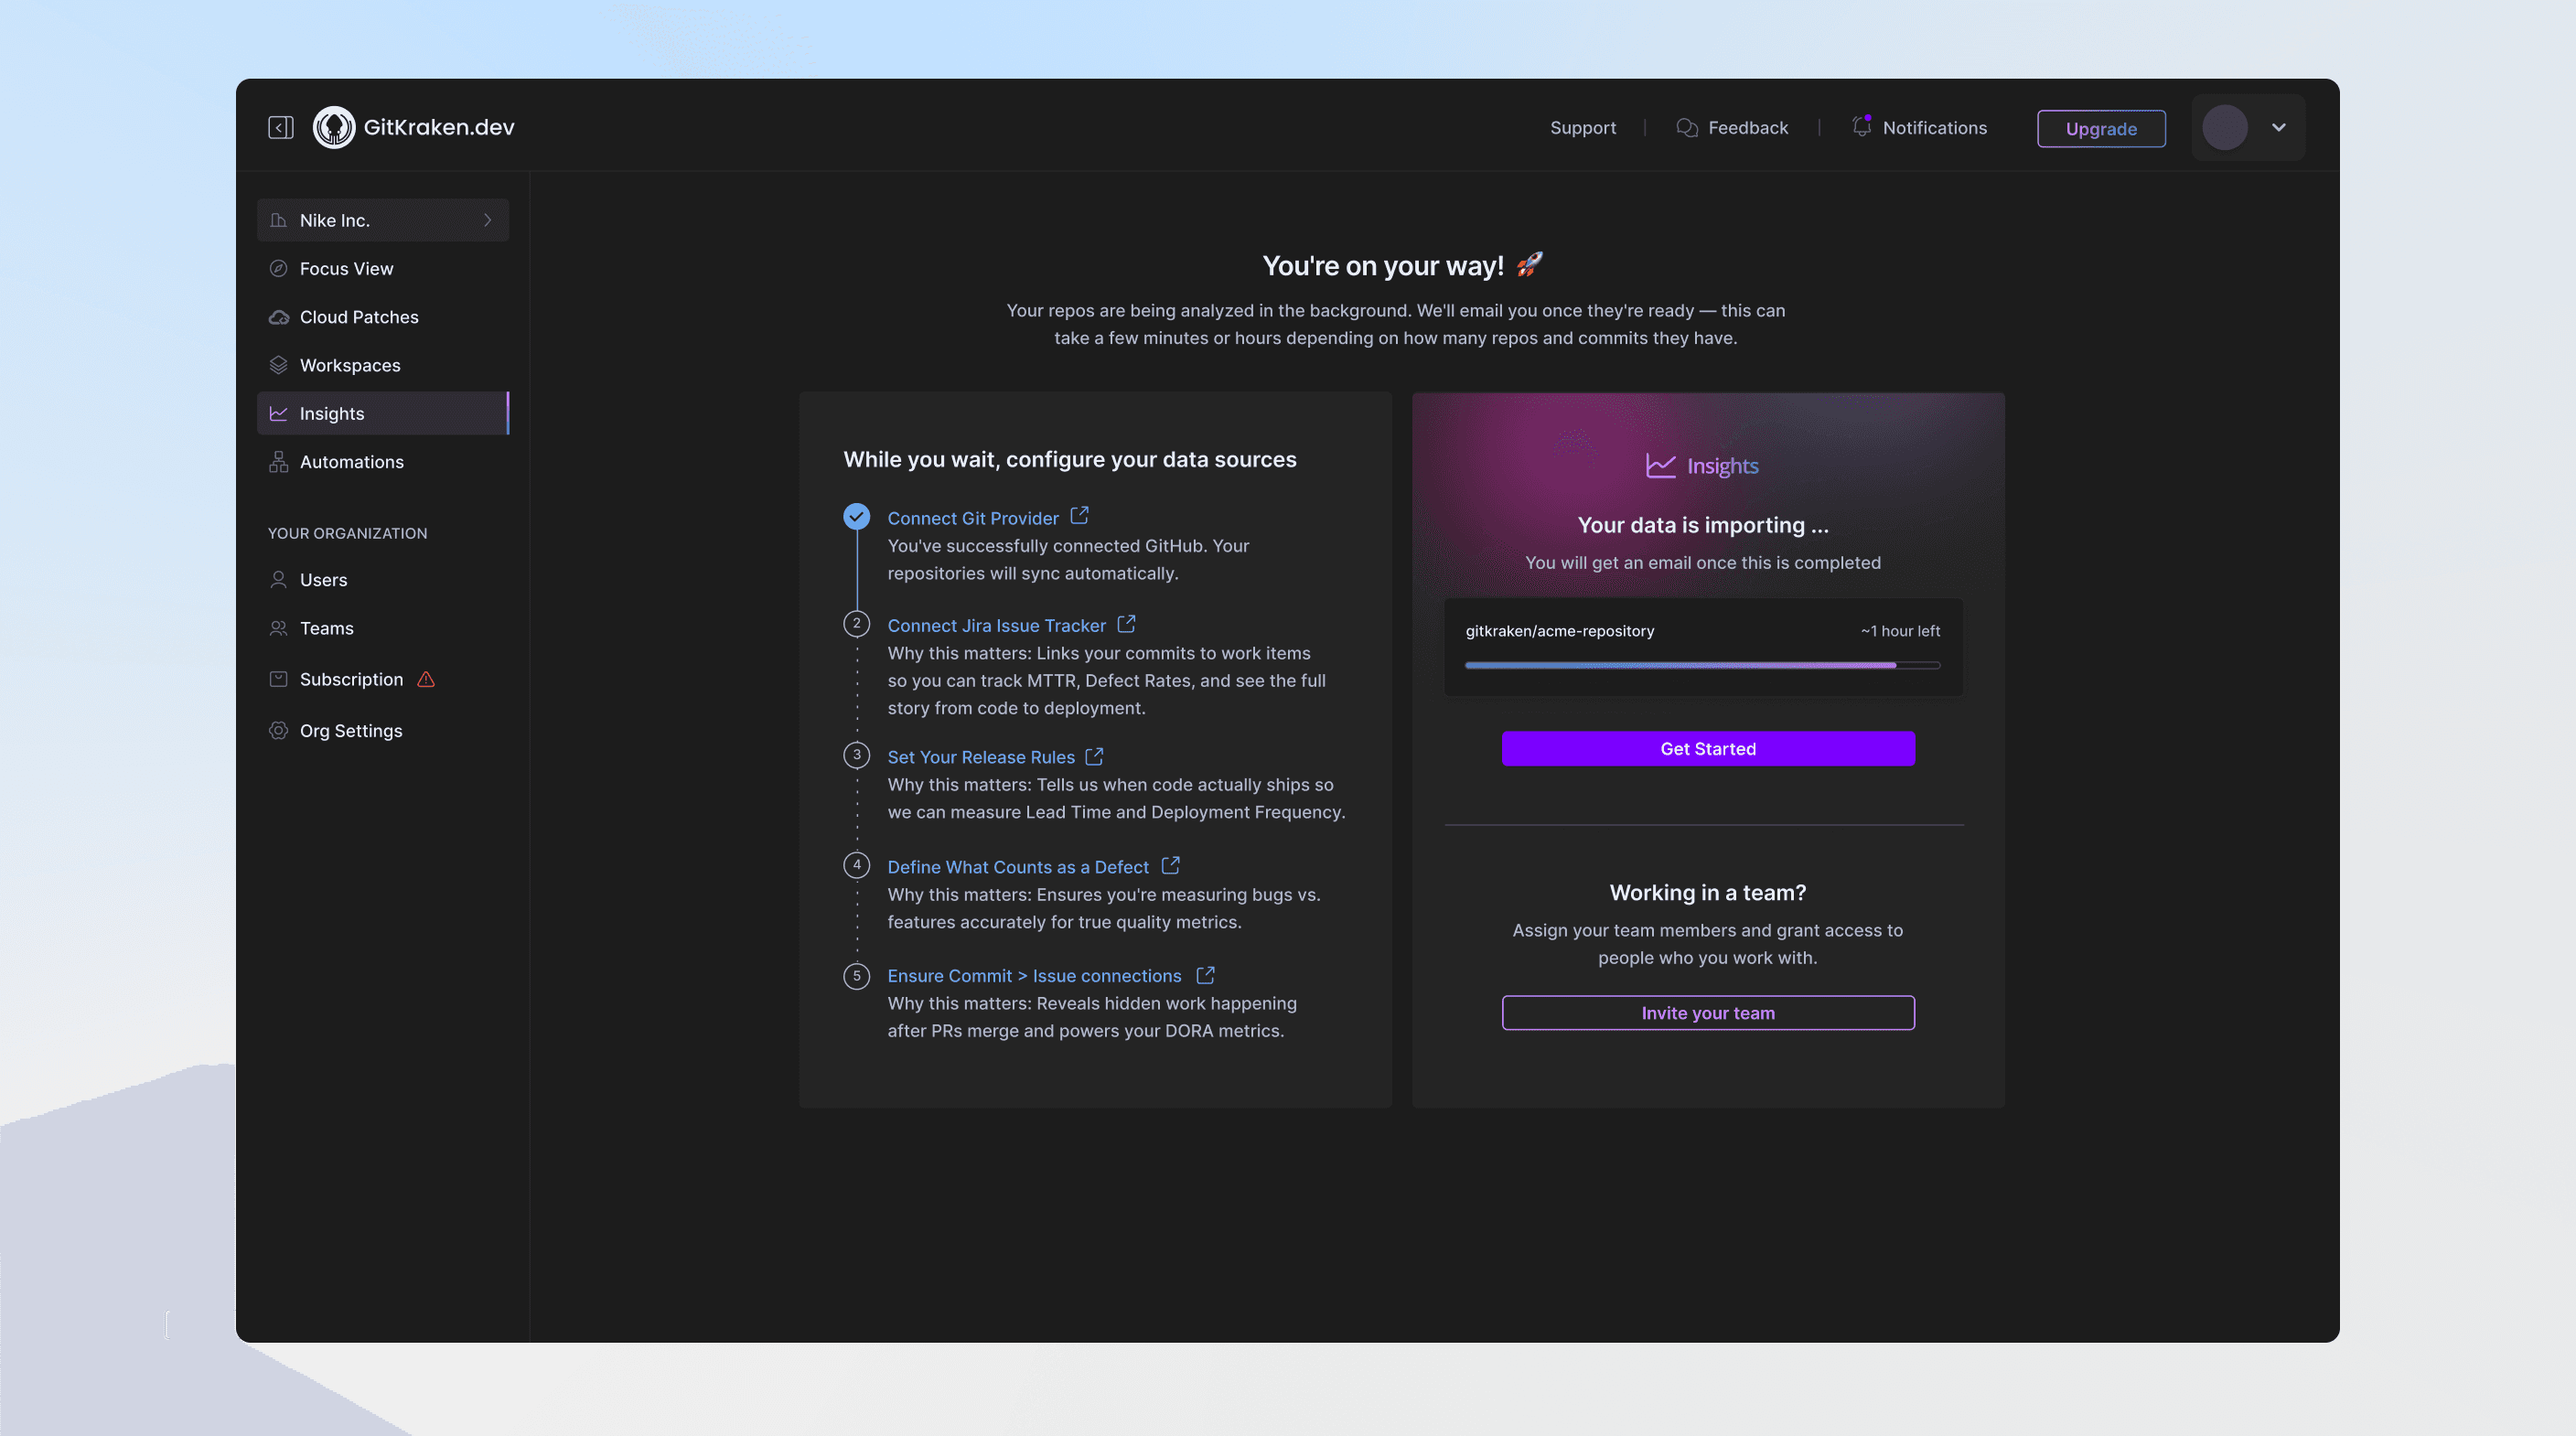
Onboarding was designed to ensure all critical data sources and rules are configured upfront while repositories are being fetched. By guiding users through connecting repositories, defining release rules, and aligning issue tracking early, the system establishes a reliable data foundation from day one. This approach reduces setup friction, prevents incomplete or misleading metrics, and allows teams to start exploring Insights as soon as data ingestion is complete.
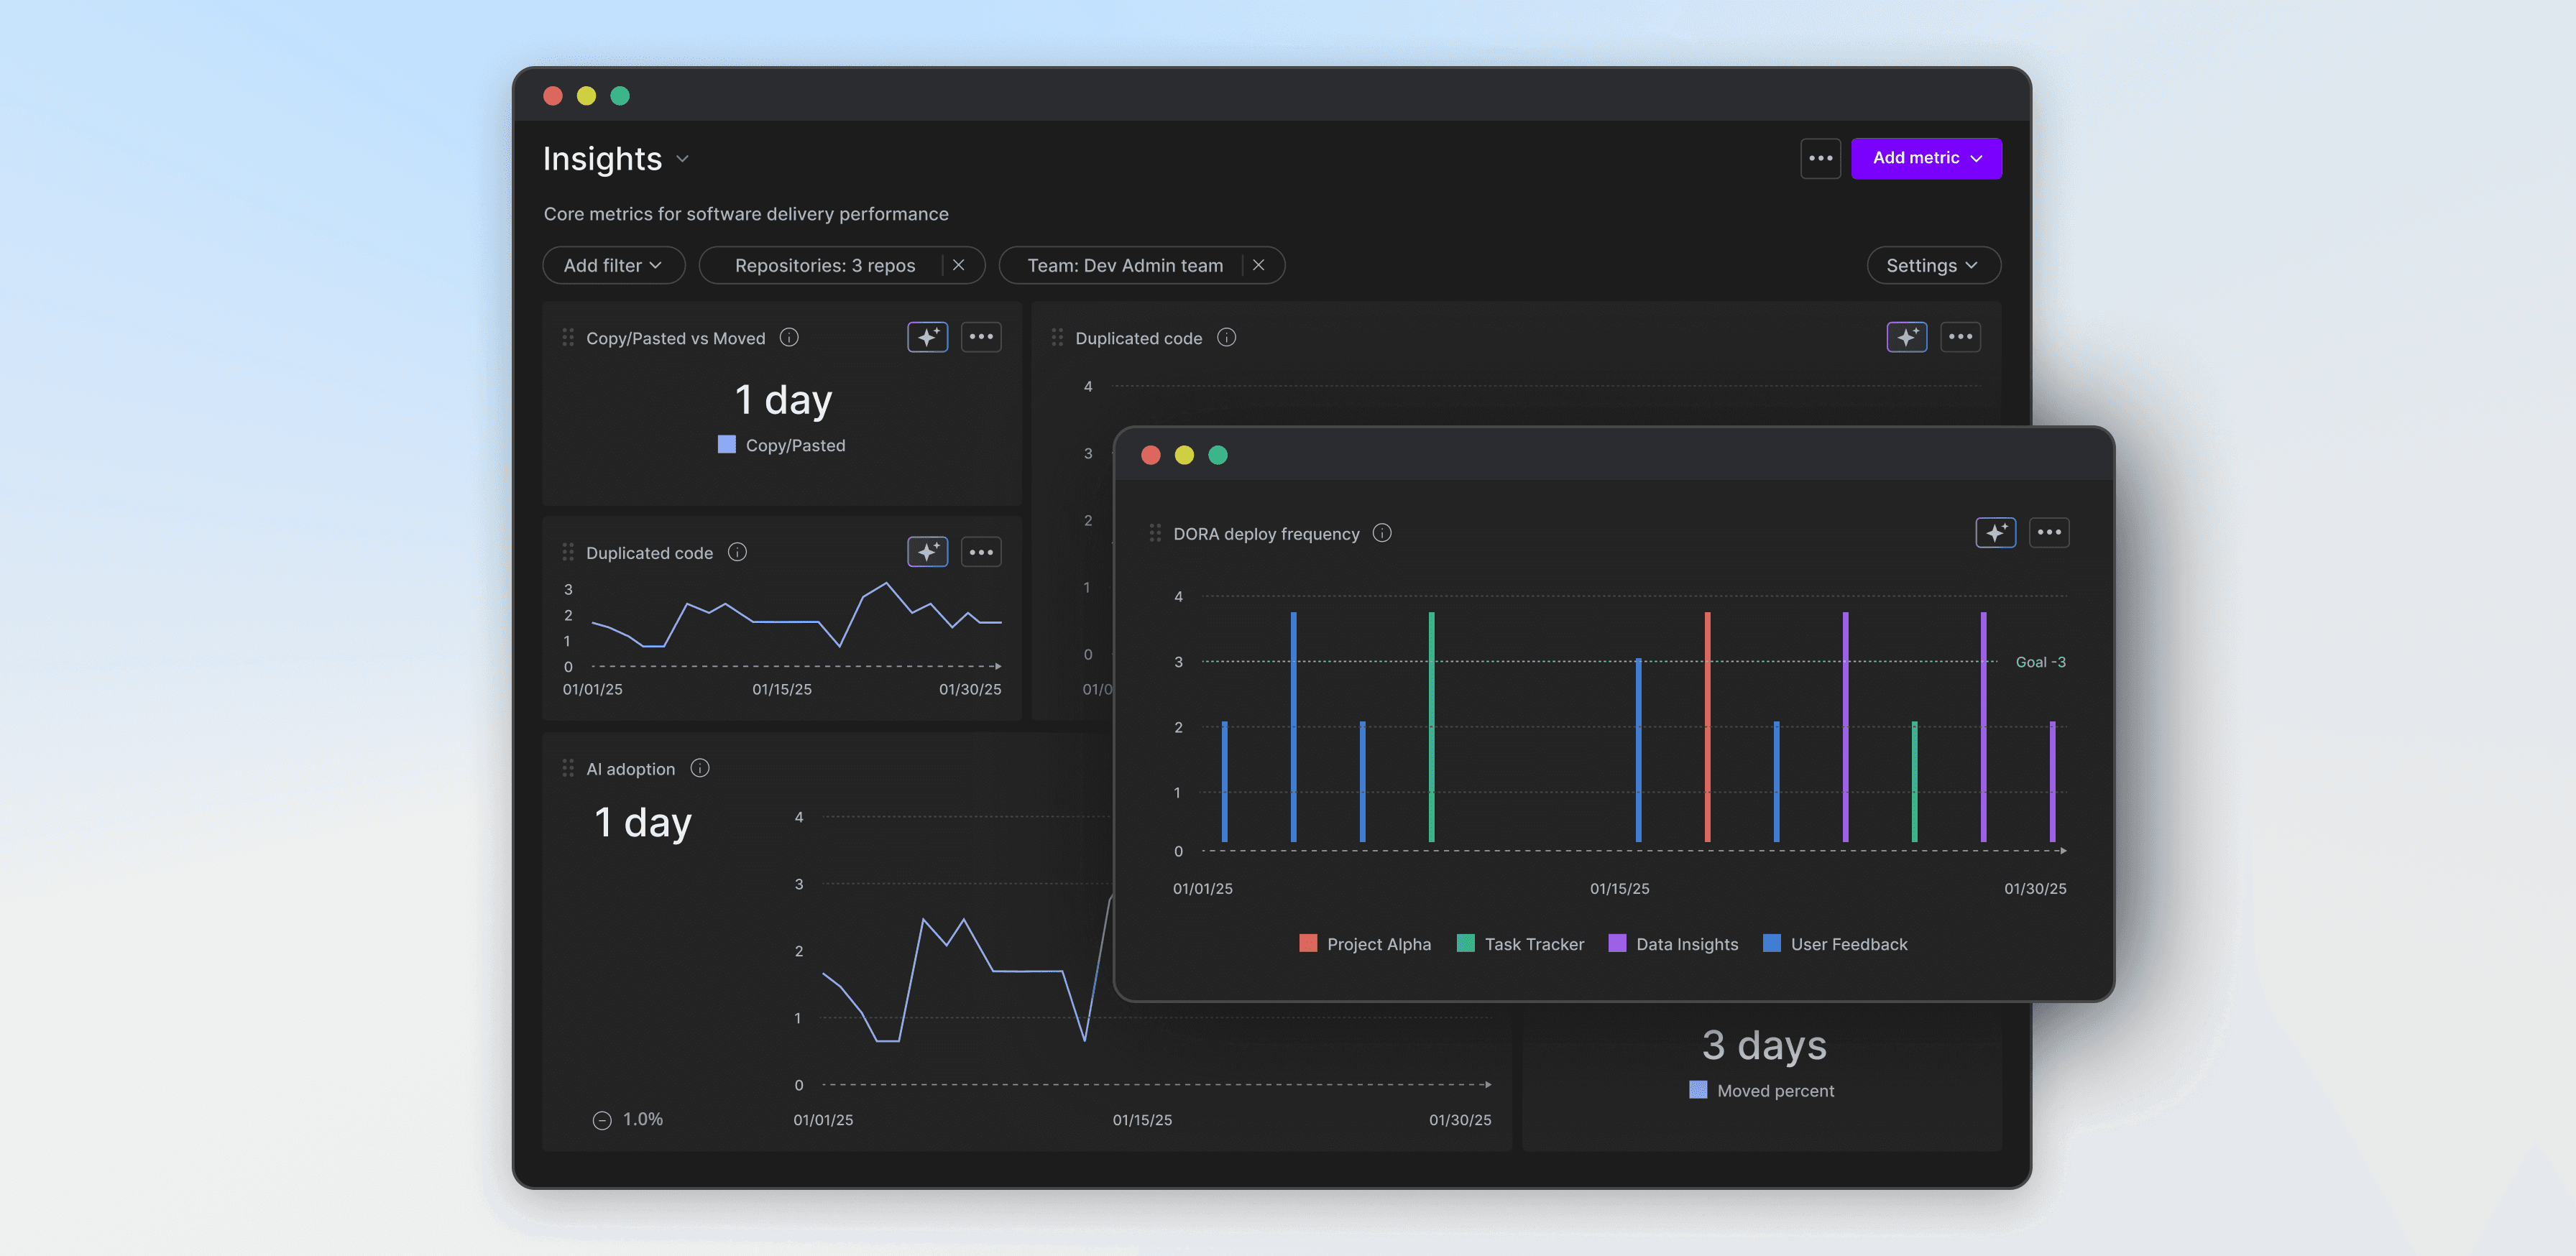
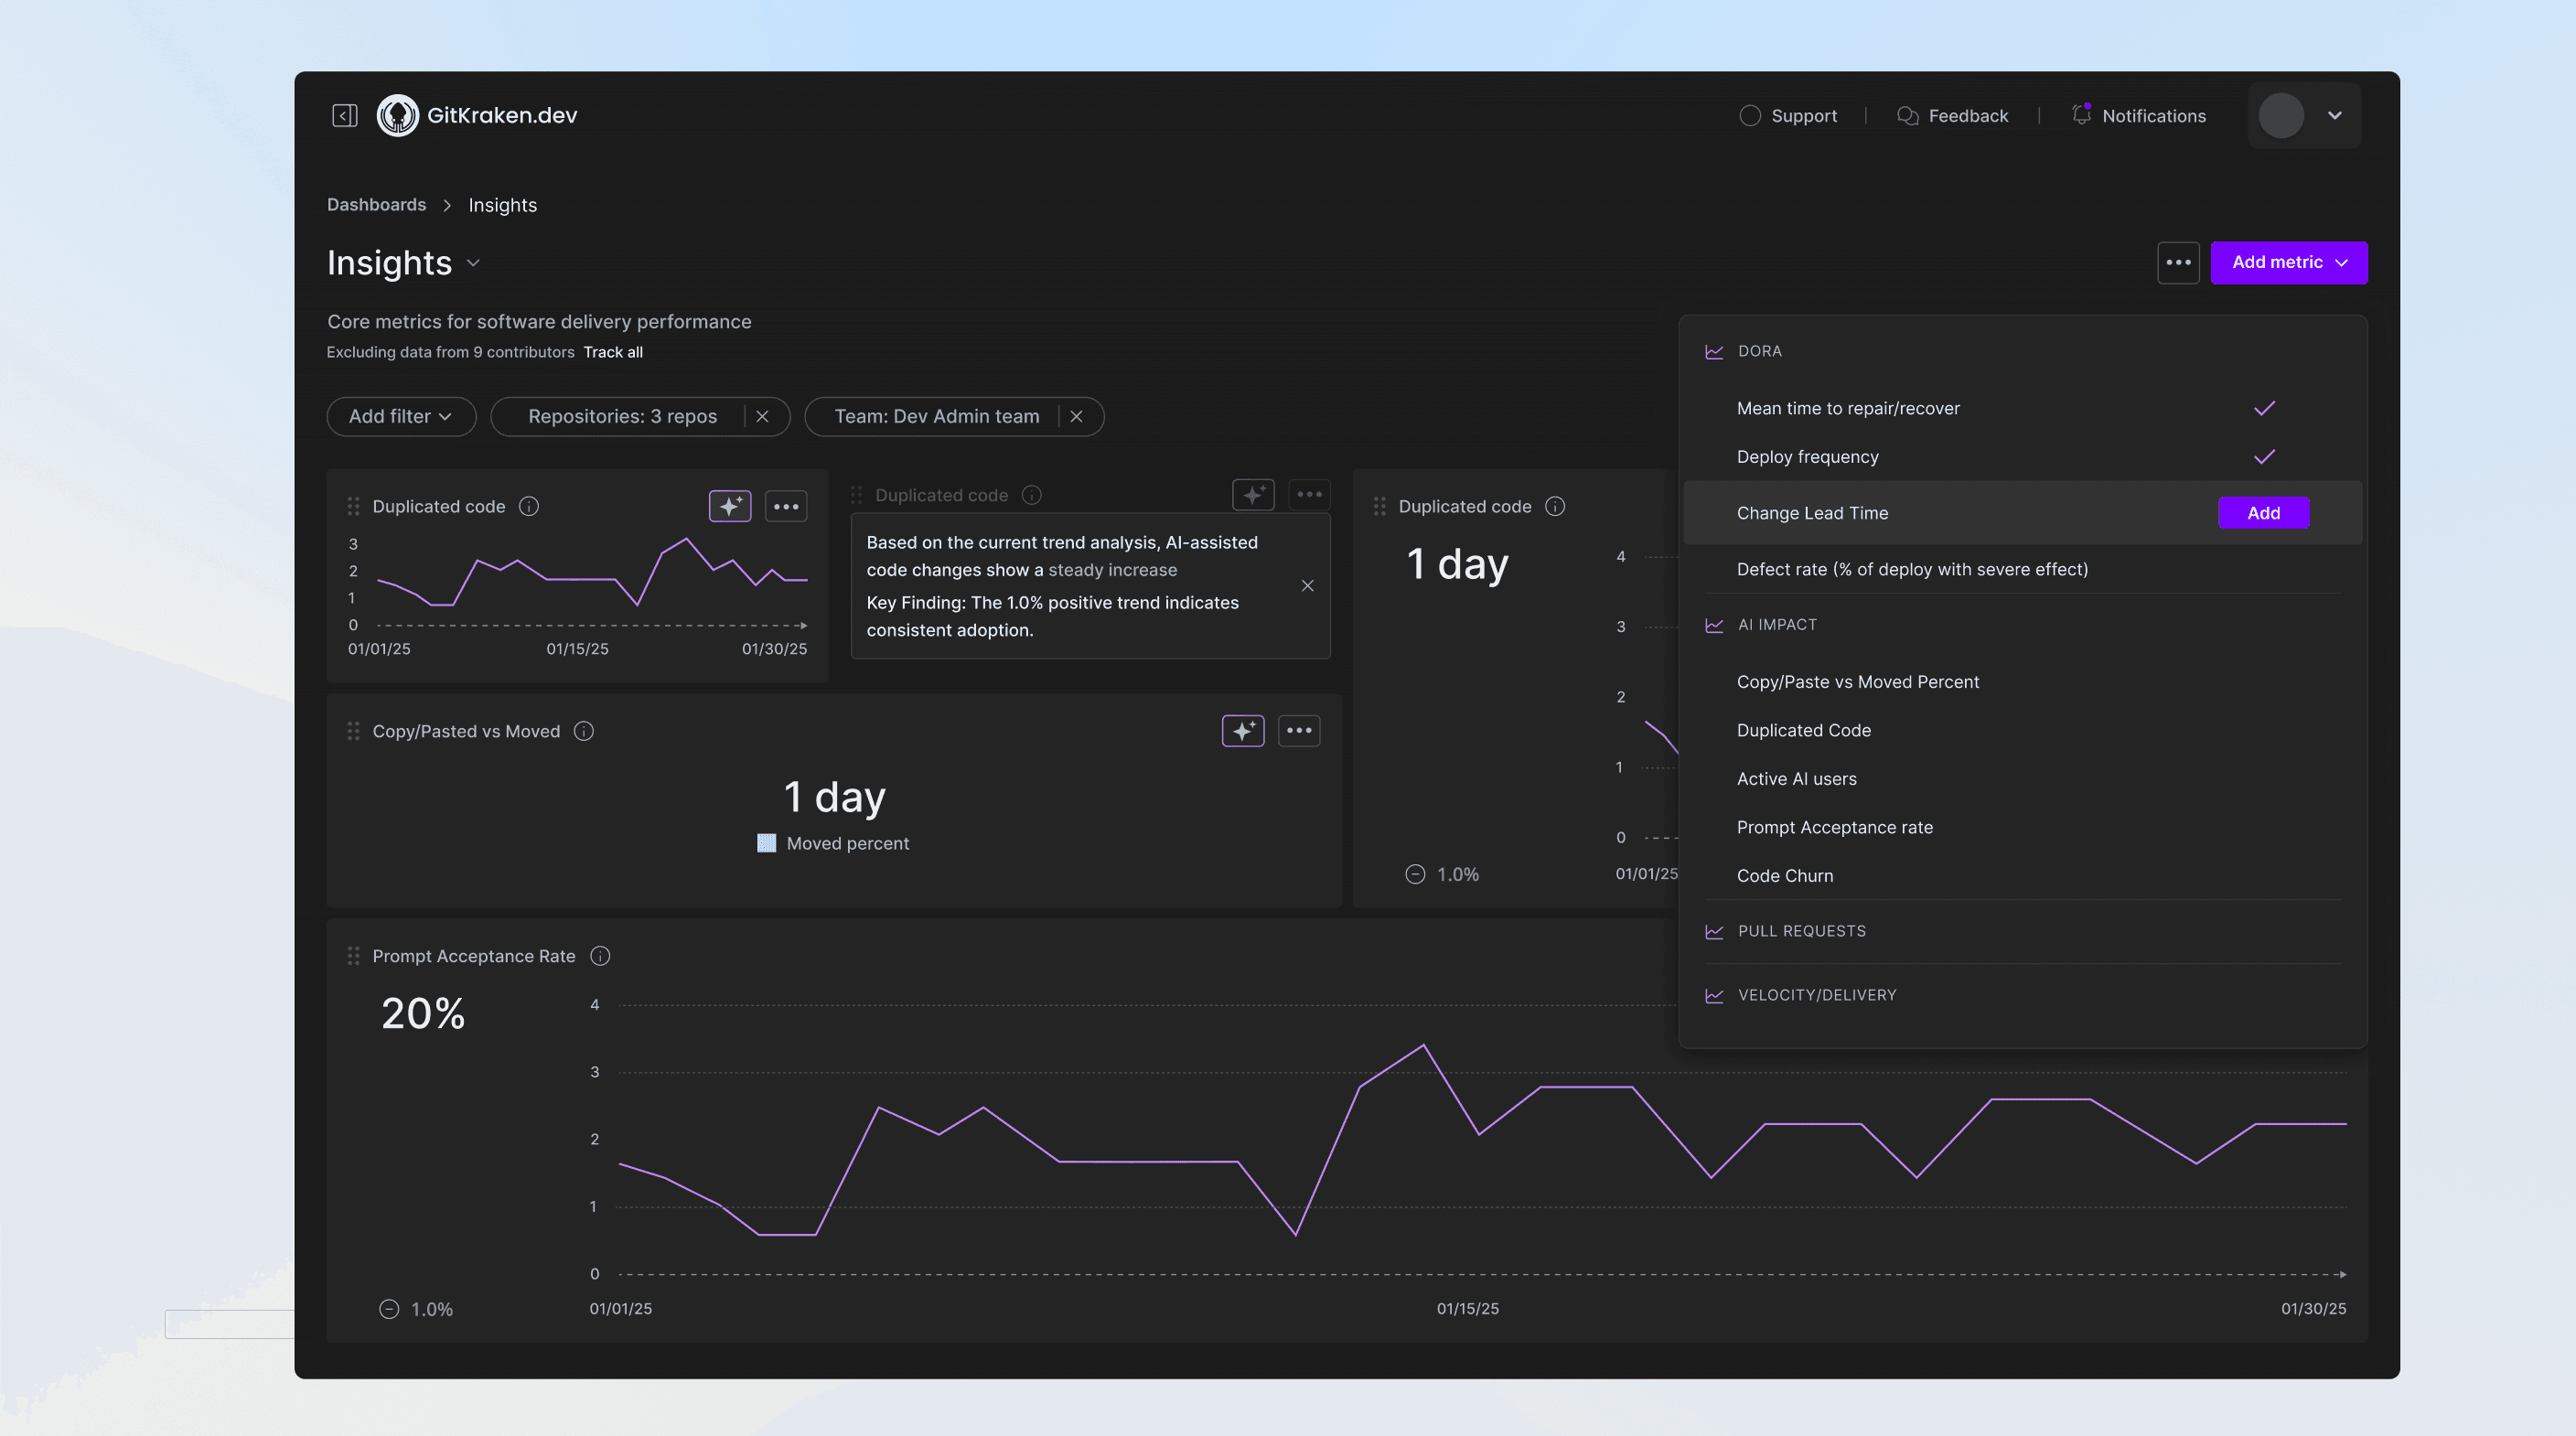
AI metrics and AI-generated summaries function as decision accelerators, not as additional layers of abstraction. AI metrics translate complex, low-level engineering signals such as PR flow, review latency, CI reliability, or context switching into interpretable indicators that reveal trends, anomalies, and risk patterns over time. AI summaries then synthesize these signals into concise, role-aware narratives that explain what changed, why it matters, and where attention is needed, removing the need for manual analysis.
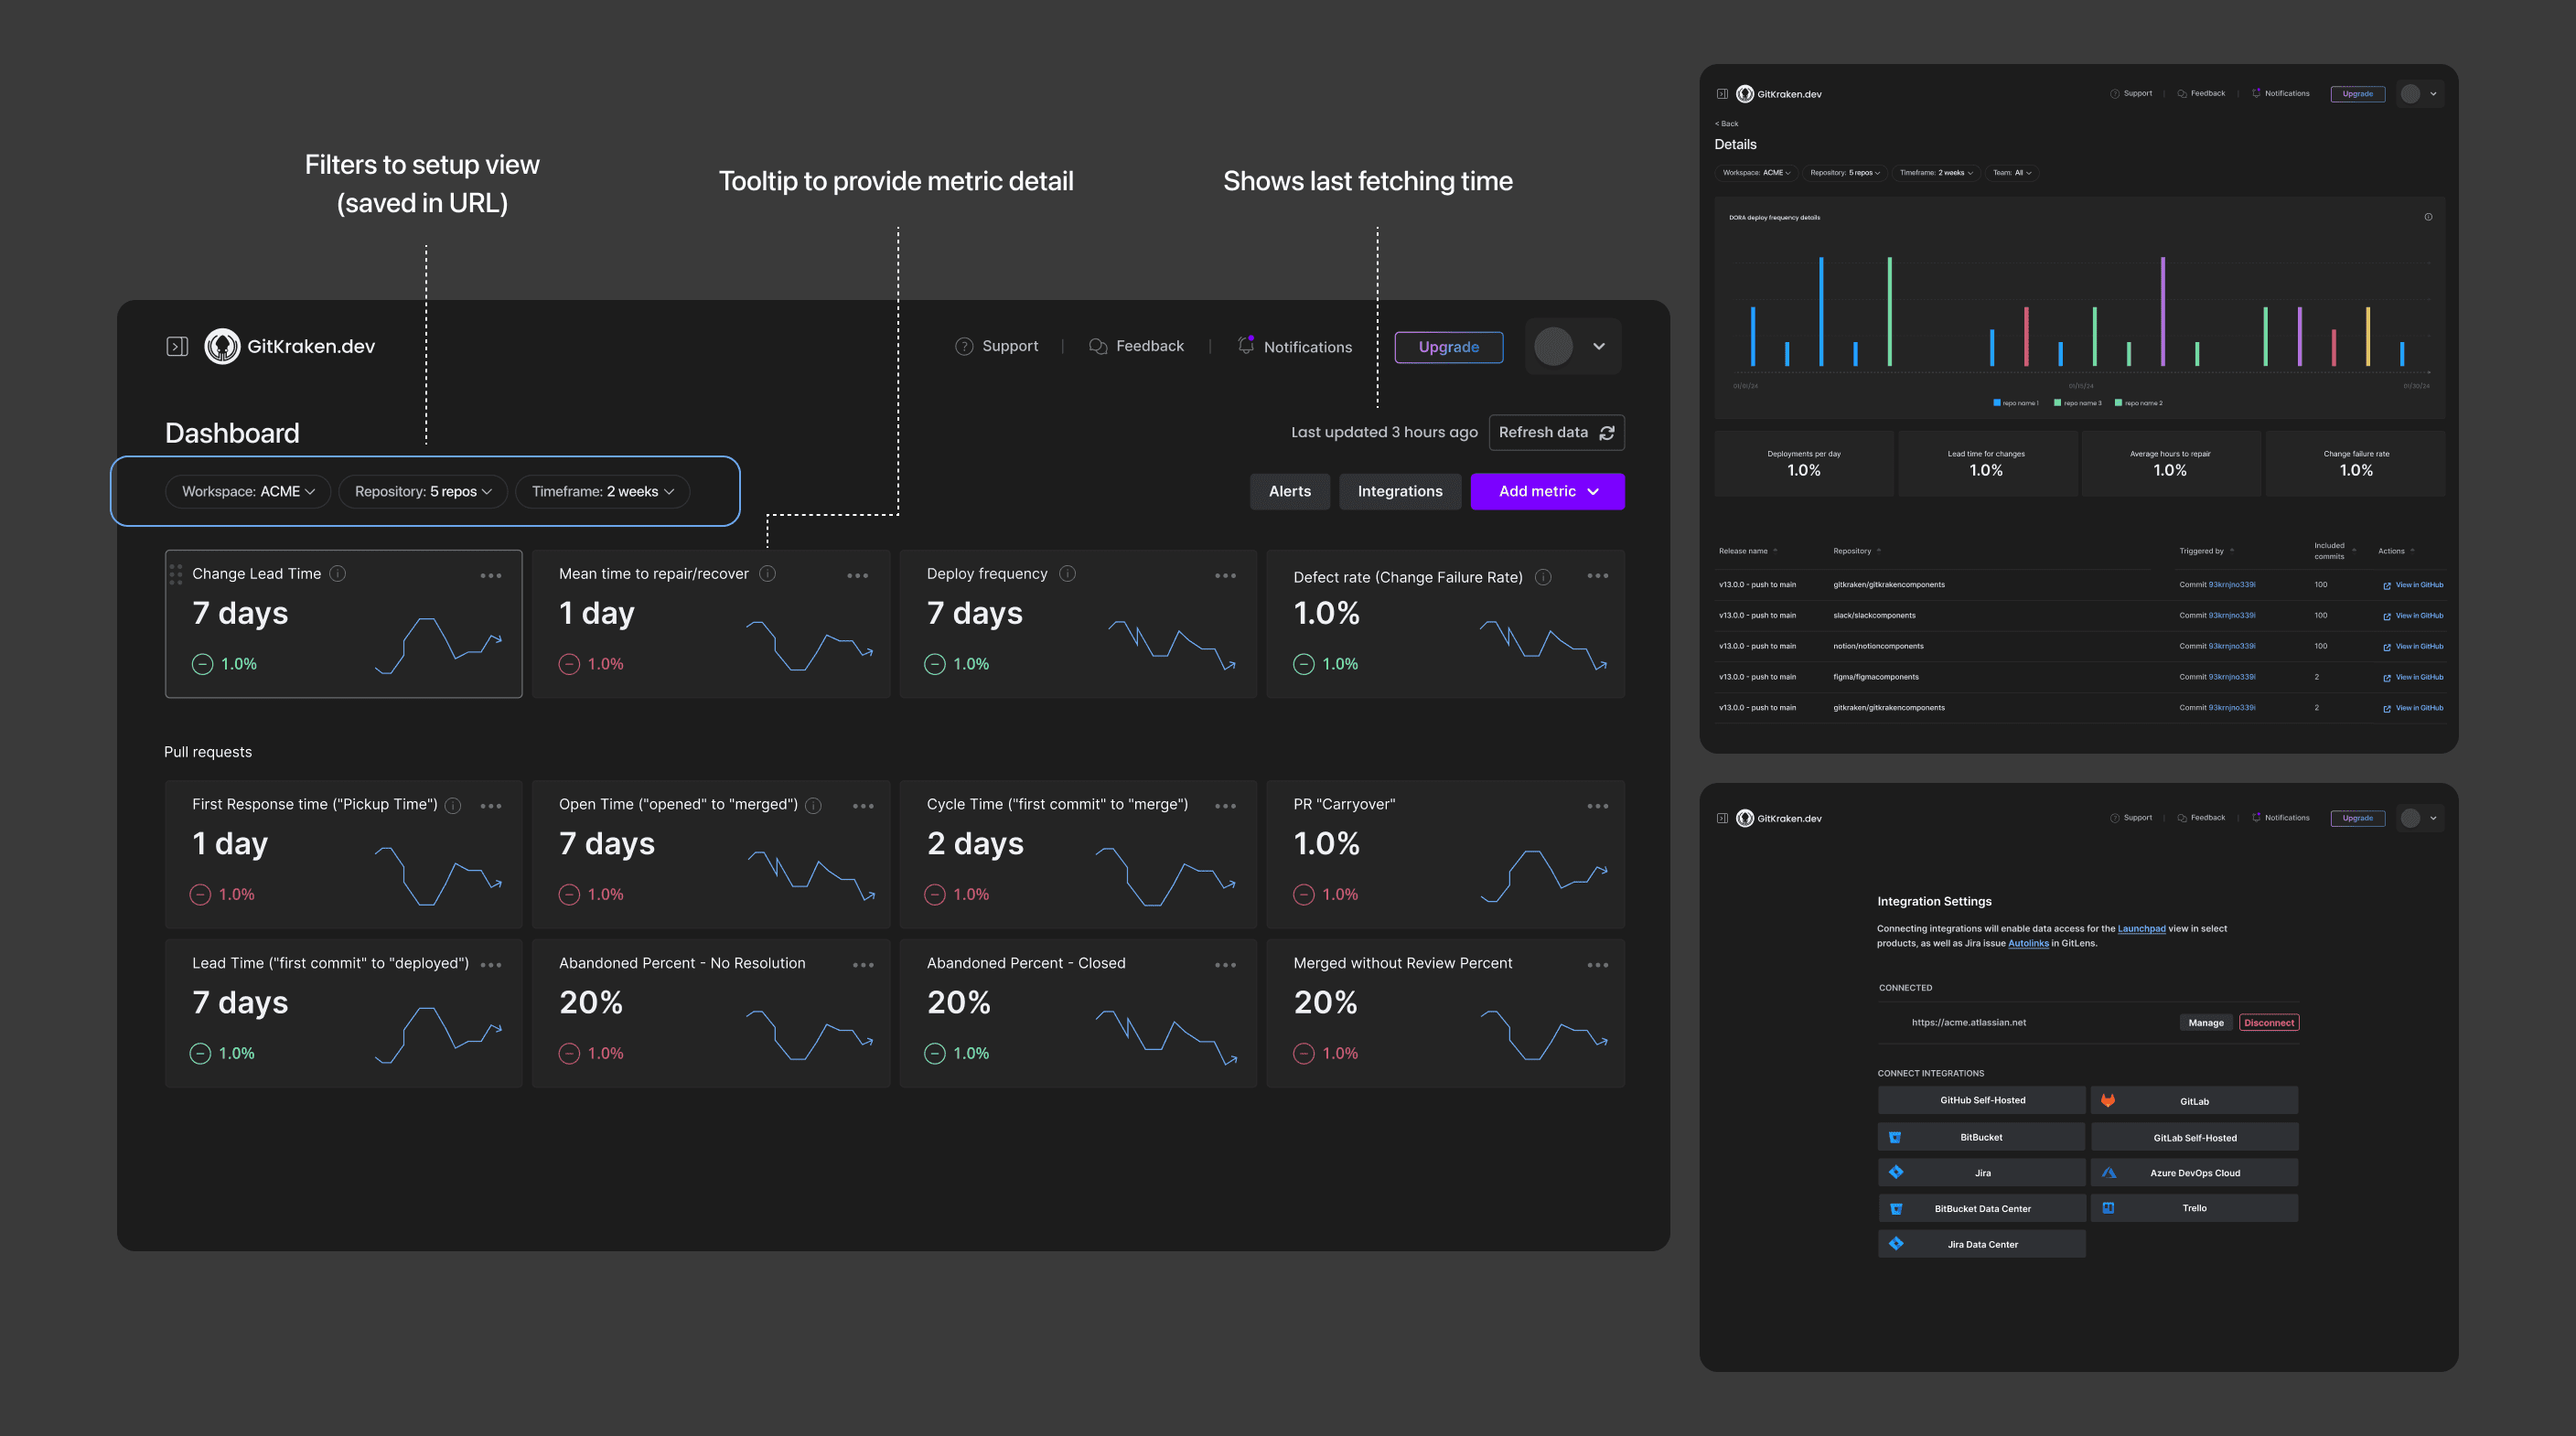
Each metric in Insights has its own dedicated detail page designed for deeper analysis and root-cause investigation. From the high-level trend, users can drill down into time-based changes, repository-level breakdowns, and supporting signals such as PR volume, commit count, and diff size. Flexible filters, grouping options, and contextual comparisons allow engineering leaders to move from “something changed” to “why it changed” without leaving the dashboard, turning metrics into actionable insights rather than static charts.
After one year in production, Insights evolved from an MVP into a core analytics surface used by engineering managers and product leaders to monitor delivery health and team performance. Usage data and customer feedback showed consistent engagement with dashboards, filters, and drilldowns, indicating that teams relied on Insights not just for reporting, but for ongoing decision-making. Over time, the product expanded to support more teams, repositories, and workflows, validating the initial design focus on flexibility, explainability, and scalable dashboard patterns.

Thank you for reading!
© 2026 - ALL RIGHTS RESERVED